
Good data collection and database design can save a lot of time when it comes to the data analysis. If not, you can often spend hours trawling through messy data, trying to clean it up enough so that it is in a suitable state for analysis.
In the world of big data, collecting as much data as possible sounds like a great idea, but with GDPR and data protection regulations, you also have to make sure the database meets the standards for data security and privacy.
In this database design assignment, we were given some sample data and a brief for the database to meet:
“You are working as a researcher linked to an NHS health trust. You are looking at the impact of arthritis on activity in a range of patients between 30 and 90 years old. Initially the patients will be split by age group, but in the near future they also want to split the groups by gender and ethnicity. You need to design a database for patients who are coming in for the study.”
We were given data on four fictitious patients containing information on a wide range of variables:
Name, Age, Height, Weight, Ethnicity, Religion, Gender, Marital Status, Profession, Address, Phone, E-mail, GP, GP Address, Diagnosis, Medication, Physical Therapy, Exercise, Hobbies, Siblings, Pets, Favourite Colour and Favourite Band.
Identifying the Relevant Data
I think it goes without saying, that half of the variables for each patient are irrelevant to the study. Considering that the main study is about the impact of arthritis on activity, initially split by age, but also ethnicity and gender, it makes sense to include age, diagnosis, exercise, ethnicity and gender.
On top of that, I would say that there are a few confounding variables here too. For example, weight, medication and physical therapy are likely to affect the severity of the arthritis and discomfort experienced by the patient, which in turn would likely effect how much a exercise a patient is comfortable with. With that in mind, I would also include these in the database.
Finally, there is the issue of identifying patient records. If two patients have the same age, ethnicity and gender, then currently you wouldn’t be able to identify which record relates to each patient. To solve this, I would also include name and address. Phone number and email address would also work, but given the regulations I mentioned at the start, since these data aren’t necessary for the study, I will leave them out.
Arguably, you could add in profession and hobbies as more active jobs or hobbies could make the arthritis worse and then the patient would be inclined to exercise less. However, since we are just given the names of these and no indication on how much activity they may include, I will leave the out.
Creating the Database
For the database creation, we were told to use Excel and using the variables just mentioned, I came up with this:

You could just use this, but it is a very inefficient database due to having multiple pieces of data in each column, such as the two medications for Albert. I could create two medication columns or two entries for Albert and put a different medication in each row, but all this does is make the database bloated with redundant data.
On top of that, the formatting is not very conducive to database searching. If this was going to be searching using a programming language, they wouldn’t work very well with the headings that contain spaces and some of the observation terms are quite long and complex too.
Improving the Database
I want the database to be easy to search and easy to use with another programming language for analysis. So first, let’s clear up those headings and simplify the observations.

As you can see, I removed the capitalisation and used underscores instead of spaces on the headings to allow easier integration with other programming languages. I also changed the physical therapy and exercise heading to be per week, so that I could simplify the observations. I’ve also changed the doses to qD (every day) and q2W (every 2 weeks).
Now onto the issue regarding multiple pieces of data in a single column. I’ll go through the process of normalization, which basically is the process of making sure that data is only in the data base once.
First Normal Form
Databases must meet three requirements to be in the First Normal Form:
There should be no repeating columns containing the same kind of data.
All columns should contain a single value.
There should be a primary key to uniquely identify each row.
The database already meets rule one, but the second rule is violated by Albert’s two medicines and Karen’s mixed ethnicity. To fix this, the medications and ethnicity details will need to be moved to a separate table entirely.
The last requirement can be easily met by adding a column with a unique number for each patient, I’ll call this patient_id. This is the primary key and I can use this in the new medicine and ethnicity tables to identify what other records the details belong to.
Regarding the second rule, I would also argue the diagnosis column contains three pieces of information, the severity, laterality (left/right) and location of the arthritis, so I will split it up. You could say the same about the name and address, but as they are only there for identification and would not be needed for data analysis, I will leave them how they are.
After doing that, the main table looks like this:

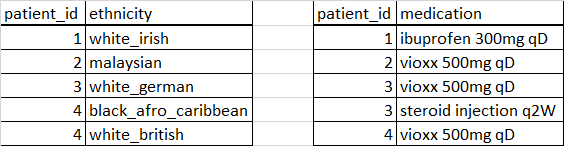
Using the patient ID you can then look up the relevant medication or ethnicity in the separate tables:
Second and Third Normal Form
By making the database meet the First Normal Form requirements, we removed redundancy across columns. The Second Normal Form deals with redundancy across rows and the third normal form requires data that is not dependent on the primary key but is dependent on other data to be moved into a separate table.
For example, to fulfill the Second Normal Form, we could move arthritis severity to its own table with an identifier for mild or advance and then use the identifier in the main table. Them same would go for laterality, location and the medication as it stands. Once there are patients with the same medication but different dosages, then the dosage would need a table of its own as well.
With the Third Normal Form, the city, country and postcode are not unique to each primary key as multiple patients may live in the same area, so these can be moved to different tables too as long as you have one of them copied into the main table to allow you too look up the rest of the information.
This may get very complex once you introduce patients with arthritis in multiple joints and with different severity in each joint.
When using large complex databases, this may work extremely well, but as we are using Excel which is more of a spreadsheet tool, it would take a long time to find all the identifiers and go to each table and figure out all the information relating to one person. So for now, we will leave this as it is.
Relationships between Tables
The final thing to do, is make the tables relate to each other, so that if one person wants to find the medication information, they can look between the tables, using the patient_id, and find the information they need.
In Excel, you can create a data model using the Power Pivot tool to relate data between tables like so:
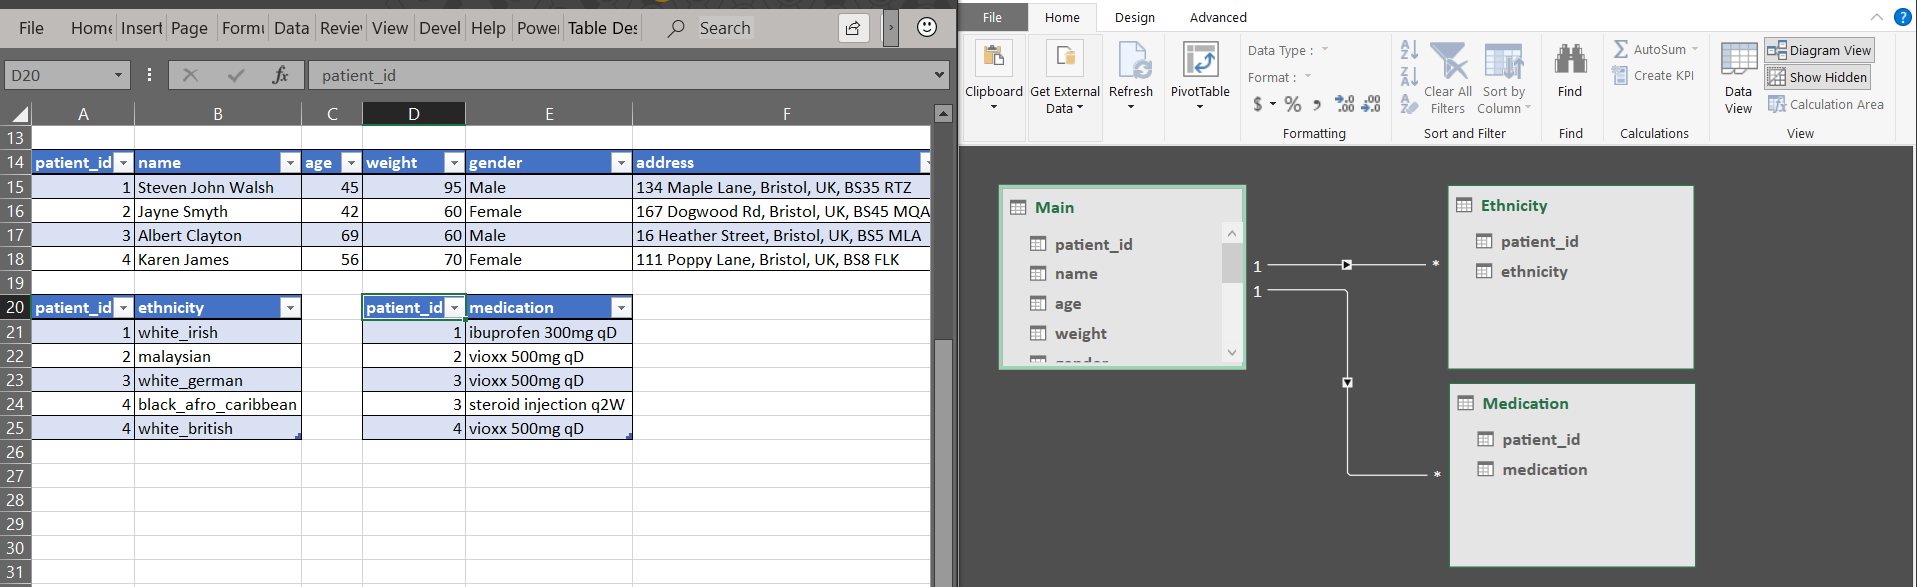
What I’ve done is add the tables to the data model and then created relationships between the data using the patient_id column as an identifier. As far as I can tell, this is as far as you can take a database in Excel. These data models in Excel work well with numeric data like sales and you can create Pivot Tables using the model, however it does not work very well with categorical data like this, but it is a good example of how tables are related in database programs.
If there was more data, this assignment would definitely be a lot more complex like I mentioned when it came to the Second and Third Normal Form, but as it stands, creating this database was manageable. If this study was to actually happen, I do think it would be useful to also know how active the patient’s job is as it could be a confounding variable, although difficult to quantify. The type of exercise would also affect how much discomfort someone gets from their arthritis as well, so that could also be useful information.
